SELECT "trans"."tran_date",
"trans"."tran_type",
"trans"."tran_item_no",
"trans"."tran_qty"
|
| Home | Previous Lesson: Crosstab Presentation Style Next Lesson: Composite Presentation Style |
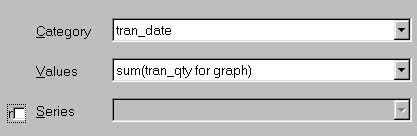
PowerBuilder allows you to retrieve data and display it as a Graph, with/without the data appearing along with the graph in the DataWindow. Whilst the graph engine might not be as powerful as those bundled up with some spreadsheet packages, it should be able to produce enough varieties to cater to most business needs.
SELECT "trans"."tran_date",
"trans"."tran_type",
"trans"."tran_item_no",
"trans"."tran_qty"
|
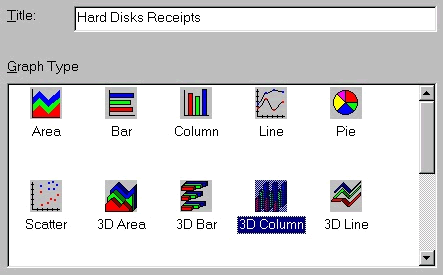
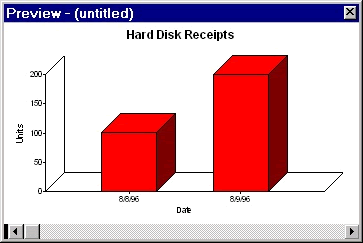
The preview shows the report as shown in the following picture. In fact, PowerBuilder supports a bunch of other graph types, select them from General tab page in the properties sheet. For detailed information on all those options, please refer to the Graph Control in the Window painter session.
| Home | Previous Lesson: Crosstab Presentation Style Next Lesson: Composite Presentation Style |