| Home | Previous Lesson: Label Presentation Style Next Lesson: Graph Presentation Style |
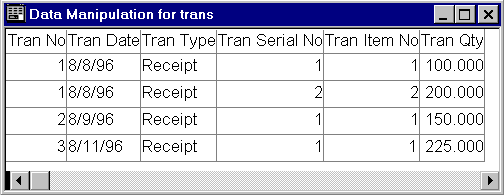
Without this presentation style, you end up writing hundreds of lines of code in the PowerBuilder application, or the DBA has to write huge stored procedures. Let's say the trans table has the following data.
Say for example you want to print a report that lists all the products and quantity issued each day. That means, you list all the products one per each row, and list the dates horizontally. Remember, each month has different number of days, 28, 29, 20, 31. (20 is not a mistake, if the report is generated on 20th of a month, then the report should list dates only till 20th). That means you need to paint four reports and use the appropriate one depending on the month. To print only those dates in the heading for which there is data is really a tough job. Let the report you want look like:
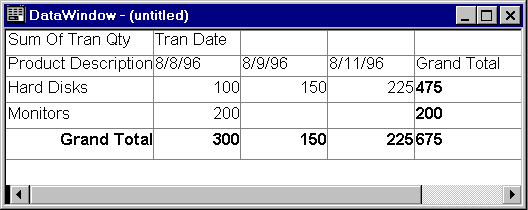
If Crosstab presentation style is used, then there is no need of four reports. Instead, paint one and PowerBuilder will take care of the rest. PowerBuilder also prints the summary at the end of each record (right most side) and at the end of the report. Well, you can also print footer for each page. Let's see how to paint this type of DataWindow.
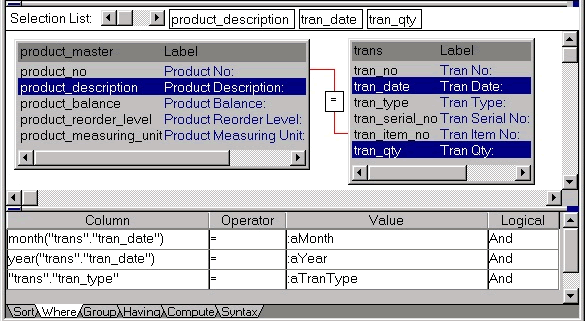
Select product_description, tran_date, tran_qty columns and paint the data source as shown in the following picture. Make sure you define three arguments as shown in the table listed below the picture.
|
Argument Name |
Datatype |
|
AMONTH |
Number |
|
AYEAR |
Number |
|
ATranType |
String |
This query brings all the transactions of given type for the given month in a given year from trans and product_master tables. Once data source is defined, select 'File > Return to DataWindow Painter' menu option. PowerBuilder prompts you for the Crosstab definition.
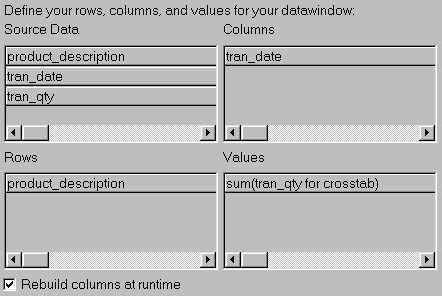
There are three parts to a Crosstab: columns, rows and values. Columns in Columns box appear in the header band and repeats at the top of each page. The columns specified in the Rows box would appear on each record, at the left most side. You can drag columns from 'Source Data' ListBox and drop on other ListBoxes. The 'Rebuild Columns at Runtime' is a very important attribute. If you select this option, PowerBuilder generates new columns at runtime, if necessary. For example, in trans table, we have data just for four days. Painting the DataWindow at this time would generate four columns across the DataWindow. If the 'Rebuild Columns at Runtime' option is not selected and the same report is executed when it has data for all the days in June 1999, you still get data for those four days only. But, if turn on this option, PowerBuilder generates the new columns at run-time on the fly.
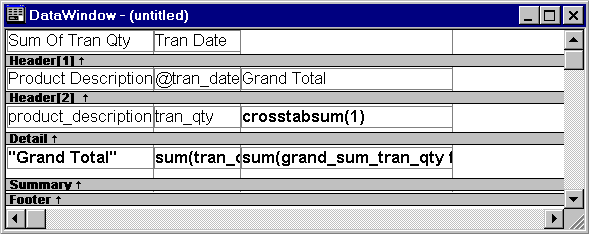
You might find the Grand totals at the bottom of the report in the Summary band are meaningless, since the sum of Hard disks and Monitors doesn't make sense. You can remove those totals at the bottom. However, the totals on the right hand side are still good. Similar to the Grid DataWindow, you can:
Please note that, unlike other presentation styles, you can not place Computed Fields on the right-side of the DataWindow. If you need some functionality like that, try to use Computed columns instead or place Computed Fields on the left side if it serves the purpose.
| Home | Previous Lesson: Label Presentation Style Next Lesson: Graph Presentation Style |