| Home | Previous Lesson: General Protection Fault Errors Next Lesson: Summary |
This debugger is redesigned completely, and comes with new features which PowerBuilder developers were anxiously waiting for a long time. In this section you will learn about the debugger's new features and user interface.
The new debug window layout has several views and each view displays different information about the applications status. You can customize this layout by changing the position of the views or adding/deleting views from the layout. Save these layouts with different names. Next time when you invoke the debugger, PowerBuilder displays the default layout and you can select one of the layout that you saved previously.
The debug layout is nothing but combination of views. Each view displays certain information regarding the current status of the application. A list of the available views are under 'Views' menu option. Selecting a view from the 'Views' option opens that view. If that view is already open in the current layout, it will open another pane with the selected view.
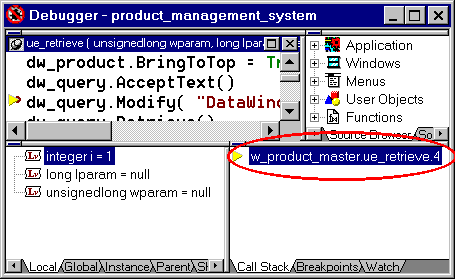
This view displays the sequence of function calls, that brought the execution to the current line of code. If there is a breakpoint in an event script then, you will just see the location information of the current breakpoint in the 'Call Stack' view.
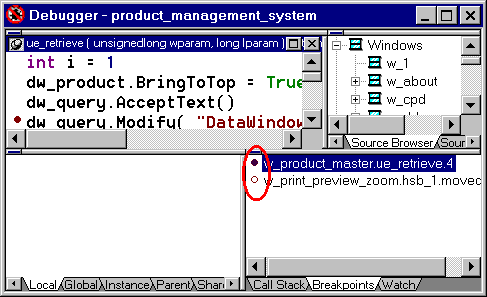
This view lists the break points set so far and their status i.e.,--active or inactive. Please note that, when you close the debugger, PowerBuilder doesn't clear the breakpoints, you need to clear them manually. In this view you can disable/enable breakpoints, set new breakpoints or clear breakpoints. Unlike the old debugger, popup menu is available in all views and the menu options are context sensitive.
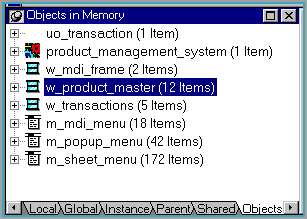
This view lists objects present in the memory at any moment of time, and you can expand them and see the value of each variable. For example, you can expand 'w_product_master' in the following picture and see the objects in that instance of the window.
Do you remember the classic problem of debugging an object, i.e., finding the value of a local instance variable in the script, when it is out of focus. An example would be when we call of_OpenSheet() with the window name as the argument, from the clicked event of every menu item that needs to open a sheet in the MDI frame.
window l_sheet
OpenSheet( l_sheet, a_window_name, &
     ParentWindow,0,Cascaded!)
Return 0
In of_OpenSheet() we are declaring a variable l_sheet of type window, and the reference to the opened sheet is placed in it. Once the function completes execution, the opened window is visible, however, we don't have any reference to that sheet, since, the local variable goes out of scope as soon the script completes execution. The problem arises when you want to debug that particular instance. How are you going to do it ? Well, the first thing that crosses the mind is to place a breakpoint in the script of that window, but, can you refer to the value of another instance of the same window ? No. For that, what you can do with this new debugger is use the 'Objects in Memory' view.
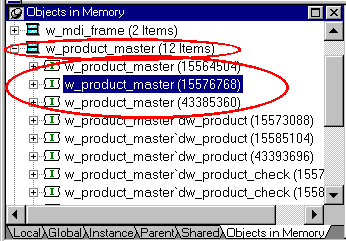
For example, the above picture has three instances of w_product_master and the current line of script is in the third instance. Expand w_product_master and you see the three instances of the same window. Expanding the second instance displays the values of that instance.
This view allows you to browse the source code of the selected script. When PowerBuilder suspends program execution at a breakpoint, this view automatically displays the source code for the script that has the breakpoint.
This view displays an expandable hierarchy of objects in the current application. Expanding to the last level and double-clicking on that level displays the source code in the 'Source' view.
This view lists the script names that were displayed in the 'Source' view so far. A good facility. You need not keep track of the scripts you saw. Selecting the script name displays the source code in the 'Source' view.
This view displays variables categorized into Local, Parent, Instance, Shared and Global, and each category occupies a tab page each. A variable value can be changed by double-clicking on it. If the current control is a CommandButton's clicked event script and if you want to see the instance variables declared at the window, which tab do you click? Not the 'Instance' tab. You should look under the 'Parent' tab.
This view displays the variables that are put on the watch list. Also you can change the variable's value from this view.
As explained earlier, each layout is divided into different panes and panes are arranged in rows and columns. Each view is displayed in a pane. When multiple layers are put in a single pane, PowerBuilder automatically creates tabbed views and displays them.
A splitter bar is displayed between each pane. When the cursor is moved over the splitter bar, PowerBuilder displays the view's title bar ( 3 in the picture ). Moving away the cursor from the splitter hides the title bar of the pane. To display the pane's title bar permanently, click on the pushpin. The title bar will be shown ( 2 in the picture ) and the display is adjusted accordingly.
If the pane has a tabbed view and you want to move one of the tabbed view from that pane, click on the tab and drag it to the intended place. If you move the view to a pane that already has view in it, PowerBuilder automatically creates a tabbed view and makes the dragged view into a tabbed page view. To move the pane that has only one view ( no tab pages ), move the mouse to the pane's handle ( 1 in the picture ) and drag the pane when the cursor changes.
| To move a pane | Drop the outline |
| Between two panes | On the splitter bar between the panes. |
| Between a border and a pane | At the side of the pane nearer to the border. |
| Into a new row | On the splitter bar between two rows or at the top/bottom of the Debug window. |
| Into a new column | On the splitter bar between two columns or at the left/right edges of the Debug window. |
| Onto a stack of panes | On the middle of the pane. If the pane was not already tabbed, tabs are created |
Once you get the layout you need, you can save the layout by selecting 'Debug/Options' from the menu and selecting 'Layout' tab. Click on the 'Save As' button, the label 'Current' becomes editable and you can enter a new name. Click on 'OK' button to save the layout. There is no limitation on the number of layouts you can save. To select a different layout after invoking the debugger, select 'Debug/Options' from the menu and select 'Layout'. Click on the layout you want to use and click 'OK'. You can also restore the default layout by clicking on the 'Default' button in the 'Layout' tab.
The breakpoints are similar to the prior versions, with few enhancements such as occasional and conditional breakpoints.
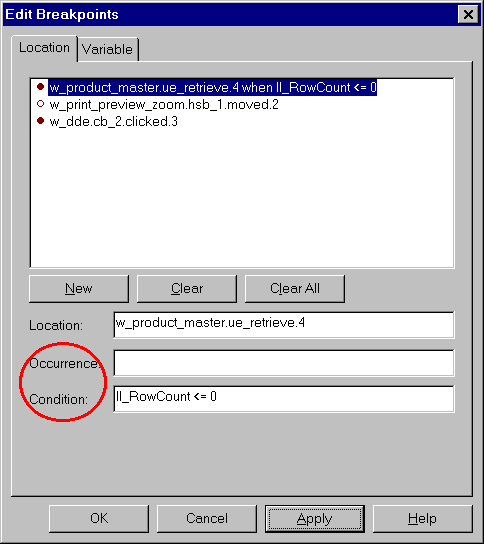
Sometimes, you may not want to debug a particular line every time that line gets executed, instead you may want to debug it on certain conditions. If that is the case, you can specify an expression that returns TRUE/FALSE values in the condition prompt. PowerBuilder suspends the execution when that expression returns true.
Specify a number in the 'occurrence' prompt, and PowerBuilder increments that number starting from value 1, whenever that line is executed. Once the counter reaches the specified number, PowerBuilder suspends the execution and resets that number and starts incrementing again.
You can specify both condition and occurrence. In this case, PowerBuilder increments the counter only when the expression returns true --not every time it passes the statement, and when the counter reaches the specified number, PowerBuilder suspends the execution.
You can also set a breakpoint based on a variable change. Make sure that the variable is in the scope, i.e., local, instance, static and global variables.
This option is available in the previous versions and
was the only choice. Choosing this option executes the current line and pauses the
execution. If the current line is a function or an event firing, you will be taken into
that script. However, unlike the Java-debugger where you can see the execution of system
classes --classes supplied by SUN Microsystems-- you can't see the source code for the
PowerBuilder system classes in the debugger window. Select 'Debug/Step In' option from the menu or
click on ![]() icon from the
Painterbar.
icon from the
Painterbar.
If the current line is a function or if it is firing an
event, choose this option to allow you to run the current line script without entering
into the function/event code. Select 'Debug/Step
Over' option from the menu or click on ![]() icon from the Painterbar.
icon from the Painterbar.
This option lets you run the current script till the end
of the script, without stopping at every line. Select 'Debug/Step Out' option from the menu or
click on ![]() icon from the
Painterbar.
icon from the
Painterbar.
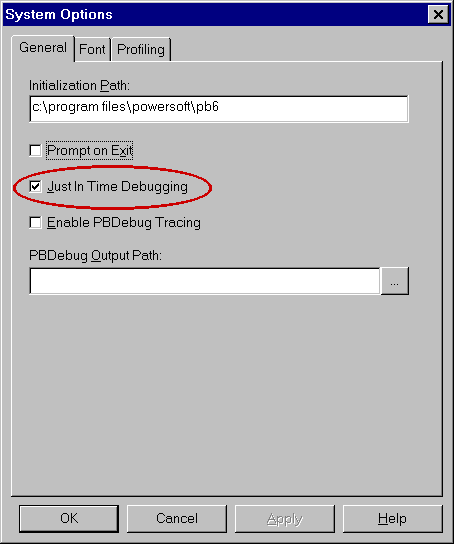
This new just-in-time debugging feature lets you to switch to debug mode, anytime you run the application in the regular mode --using Run toolbar icon-- without terminating the application. To enable this feature, you need to enable just-in-time debugging option from the system options dialog box. You may not find a menu option or toolbar icon for this option. Select 'File/ PowerPanel' from the menu and double-click on the 'System Options' option and you will see the dialog box shown below. Just turn on 'Just in time debugging' option.
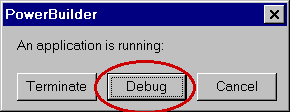
To switch to the debug mode while running the application, switch to PowerBuilder application using the Alt + Tab key combination. PowerBuilder will prompt you ( see picture below ) to choose between terminate, debug and continue options.
When you switch to the debug mode, you may not find values in the 'Source', 'Variables', 'Call Stack' and 'Object in Memory' views since, there context has not been established yet.
When running the application in the regular mode, if a system error occurs while the just-in-time debugging option is on, PowerBuilder automatically switches to the debug mode.
| Home | Previous Lesson: General Protection Fault Errors Next Lesson: Summary |