| Home | Previous Lesson: Performance Analysis - An Easy Way Next Lesson: Routine View |
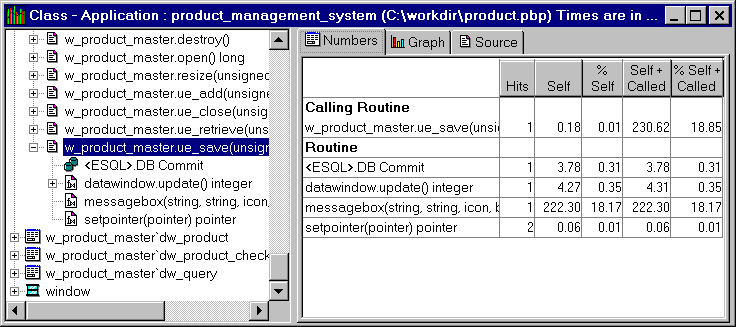
In this view you can view calls, hits and timing information for each class in the application extracted from the call graph model. Recall that we added a new record in the product master window and saved changes, that means it fires the ue_save event. The following picture display statistics about ue_save event.
Profiler displays <ESQL> class for all embedded SQL statements. From the picture you can see inserting into the database and committing the transaction took 3.78 milliseconds. Wondering a MessageBox() function took more time than anything else? Right, nothing we can do about it, since it is a built-in function, we can't tune that command any way.
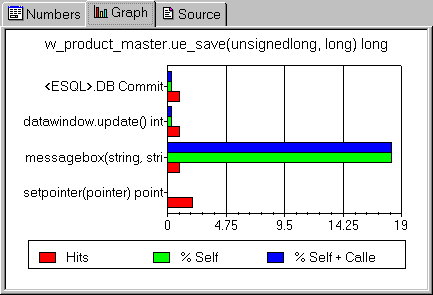
Clicking on the 'Graph' tag page will display the above statistics in graphical form as shown in the picture. Clicking on the 'Source' tab page will display the actual source code executed to create the trace file including line numbers. You can see the statistics for each line executed.
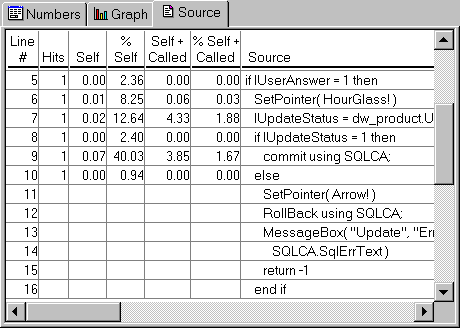
What if you changed the source code between the trace file generation and analyzing the trace file in the Profiler application. Well, you will see wrong statistics. To show this in practice, I inserted the following comments after the line that is starting with "lUserAnswer = " in the ue_save event in w_product_master window and run the profiler application.
//Testing Trace &
//Profiling API
//Delete These comments
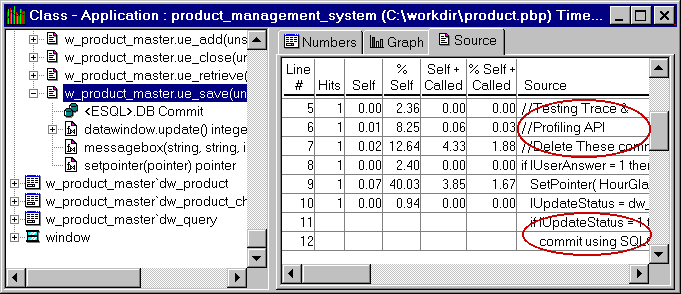
You will see the following picture which says, executing comments took some time (actually comments are stripped out from the PBL before PBD or executables are made) and also shows, the transaction was never committed which is wrong, since we find the newly added product in the database. What did you learn from this? Do the trace file analysis before you do any changes to the source code or keep a copy of your PBLs if you want to do analysis later.
| Home | Previous Lesson: Performance Analysis - An Easy Way Next Lesson: Routine View |